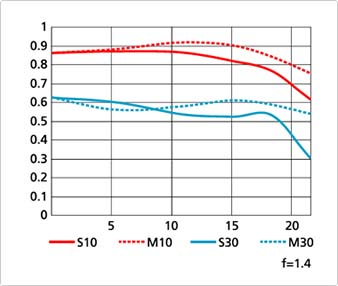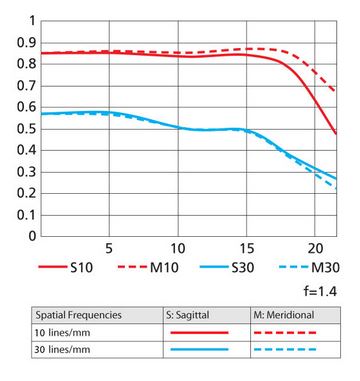
What are Modulation Transfer Function (MTF) charts for lenses. Well they are charts which indicate the general performance of the lens. There are technical performance measurements of lenses as well as the practical performance from normal image making.
The above graph is the MTF chart for the Nikon 85mm f/1.4G AF-S Nikkor lens as an example. Many MTF charts for the Nikon lenses are shown on the Nikon web site.
How do you read and understand the MTF charts?
The Modulation Transfer Function for a lens, is a measurement which evaluates the lens general performance. It will show how the lens reproduces the contrast of the scene being photographed using characteristic spatial frequencies. The spatial frequencies effectively indicates the number of lines per mm of the image.
In the MTF chart above, the horizontal axis of the chart is in millimeters and shows the distance from the center of the image on the left hand side and towards the edges of the lens on the right hand side, the highest contrast value is at 1 on the vertical axis and reduces as you move down the verticle axis. The fixed spatial frequencies of 10 lines/mm and 30 lines/mm are shown on the graph.
The path of the 10 lines/mm (red line) indicates the contrast of the lens, the higher and straighter the line the better the lens. The higher and straighter the 30 lines/mm (blue line), the higher the resolution of the lens.
Contrast reproducibility of the lens for sagittal or radial direction of the lens (solid line in the graph) and meridional or tangential direction of the lens (dotted line in the graph) varies with astigmatic performance. The path of 10 lines/mm indicates the contrast reproducibility of the lens, the higher and straighter is better. The higher and straighter the 30 lines/mm-path is, the higher the resolution of the lens.
The performance of a lens is not only to be measured with the MTF charts, as some softening or blurring of color also affects the images.
For full details of Nikon Lenses see our Nikon Lens Reviews.

